
Based on our research, we’ve developed a four-dimensional model for the digital transformation in the software-intensive embedded systems industry. In the last two posts, we explored the business model and product upgrade dimensions. This post is concerned with the data exploitation dimension.
As shown in the figure, the first step in most companies is focused on the use of data for quality assurance and diagnostics. In this case, the data often arrives at the company in batches and through customer complaints. In response to a complaint, company representatives download the data and investigate whether the system behaved incorrectly and seek to identify the root cause. Many companies have been using this type of data for decades.
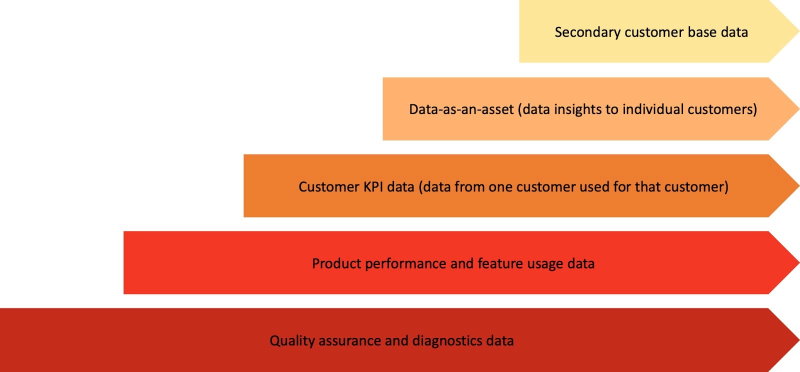
The second step is the use of data to monitor product performance and feature usage. This form of data collection is typically introduced in combination with the more frequent deployment of software. Monitoring product performance allows the company to confirm that the product is performing well after a software upgrade. Measuring feature usage allows for more informed prioritization of R&D resources by ensuring that research and development predominantly focus on improving features that are actually used by customers.
As we now have a continuous stream of data from each customer, we can move to the third stage where we can start to collect data relevant for the customer. Each customer has KPIs for which the organization optimizes, including churn in subscription service companies, measuring service usage by end-customers or classifying end-customers into segments that require different treatments. As the company now collects significant amounts of data from each customer, it can process and analyze that data and offer relevant insights to each customer. advertorial
In the third stage, we only use the data from one customer for that customer (typically for legal reasons), but the logical next step is to aggregate data from all customers and to provide relevant comparative data to each customer. At this point, the company can offer each customer an assessment of their business in how it compares to other, similar companies. This allows each customer to identify where they’re ahead of the competition, where they’re on par and where they’re behind. That facilitates the prioritization of improvement efforts at customers, which is very valuable for most of them.
Finally, in the last stage, the company engages a second business ecosystem where it monetizes data collected from its primary customer base with a secondary customer base. For instance, a truck company could sell route information of the trucks in use at its customers to gas station and road service companies. Or, a telecom company could sell aggregate movement patterns of mobile phone users to city planners.
Once the company reaches the final stage, the data that’s collected in its products deployed at its primary customer base now is increasingly concerned with meeting the needs of the secondary customer base. So, the company is likely to start collecting data that has no relevance at all for its primary customer base but that is relevant for the secondary one. A second aspect is that the company can use the revenue from the secondary customer base to subsidize the products to its primary customer base and, through that, grow its market share. Many industries, as digitalization takes hold, move towards a “winner takes all” situation and this pattern of positive feedback cycles lies at the root of it.
Concluding, digitalization has implications for the business model, the way we upgrade products and the way that we collect, use and monetize data. Companies evolve in predictable and repeatable patterns through this transformation and in this post, I described the five typical stages we encounter in our research. Data is the new oil, but if you’re not able to generate business value from your data, it doesn’t do you much good. So, get going on experimenting with different ways to create value from your data!
To get more insights earlier, sign up for my newsletter at jan@janbosch.com or follow me on janbosch.com/blog, LinkedIn (linkedin.com/in/janbosch) or Twitter (@JanBosch).
