
As companies adopt data-driven development, there is an interesting pattern that is concerned with selecting the factors that we’re optimizing for. The goal, in the end, is to influence business level key performance indicators (KPIs) such as revenue, margins, net promoter score, etc. However, these KPIs tend to change very slowly and are lagging indicators. Consequently, these are not suitable to give feedback to teams in their agile sprints. Instead we need measurable factors that change at the same pace as teams operate and that are leading indicators. In practice this means that these factors tend to be relatively low level.
Starting with low level factors is entirely the right thing to do, but one should not stop there. In the end, we are looking to establish a hierarchical value model that connects lower level factors to higher level factors, such as the aforementioned business KPIs. Preferably, the relationship between the factors and KPIs at different levels should be modeled and validated quantitatively. In practice, companies move through three stages when adopting data-driven development practices.
During the first stage of data-driven development, teams tend to pick a set of measurable, leading and fast-changing factors that, because of their nature, are lower-level. These factors are then used to guide experimentation, A/B testing and tracking the performance of subsequent releases of the product. Often these factors are selected based on an, often partially implicit, rhetoric on how these factors support the overall business KPIs.
Many companies have measurement systems in place to ensure post-deployment quality. When adopting data-driven development, the focus shifts from ensuring quality to delivering measured and validated value to customers. The existing measurement systems, however, can often be initially used to piggyback on in order to start bringing real-time data for the selected factors back from the field.
The main risk in the first stage is that teams go to great length to move the needle on their selected factors, but these factors may not actually have a significant (or even a positive) impact on the business KPIs. The consequence then is that organizations experience fabulous amounts of activity, but fail to see the expected progress when the lagging business KPIs become available. Some authors refer to this as vanity metrics, meaning that teams spend their time on driving metrics that may look good on powerpoint slides but that fail to deliver business value.
In many ways, the challenge described here is a necessary step in the process of the organization uncovering its shadow beliefs. Shadow beliefs are beliefs concerning the business, the customers and products that are widely held within the company but that are not actually true. When there is a gap between expected and realized progress for the business KPIs, the company is ready to enter the second stage.
In the second stage, the company engages in a qualitative discussion about relationship between lower level factors and key business drivers that matter. Whereas in the first stage, this relationship is often partially implicit and not discussed to any great extent, in this stage the relationship between leading and lagging factors is explicitly discussed and the underlying assumptions about the relationships are made explicit and transparent. The consequence of this stage often is that the lower level factors originally selected are updated with new selections.
Although the second stage is a significant step forward, the main challenge is that the relationship between lower and higher level factors is still only qualitatively described. Especially during experimentation and A/B testing this can lead to challenges. For instance, in our value model, we qualitatively know that both monthly active users (MAUs) and the number of shown advertisements positively contribute to revenue. Now, the result of an A/B test may be that the MAUs are up but the number of shown ads is down. As the relationship between lower level factors and business KPIs is qualitative, it makes it difficult to decide if the new alternative should be adopted or not.
In the third stage, the organization moves towards establishing quantitative relationships between business KPIs and low level factors. This is far from a trivial process as it requires “vertical” experiments and testing. In traditional A/B tests (which we refer to as “horizontal” experiments), the team looks to move the needle on the factors that they have decided to focus on. Vertical experiments are concerned with establishing the exact relationship between lower and higher level factors quantitatively. Typically this requires making some lower level factor worse for some segment of the customer base in order to determine to what extent the higher level factor is influenced. This is very difficult to convince teams and the organization of as (1) you are consciously and intentionally creating a worse experience for some customers and (2) because higher level factors tend to move more slowly, meaning that you are creating the potentially bad experience for a significant period of time. However, it is the only way we know to quantitatively establish the relationship between factors at different levels.
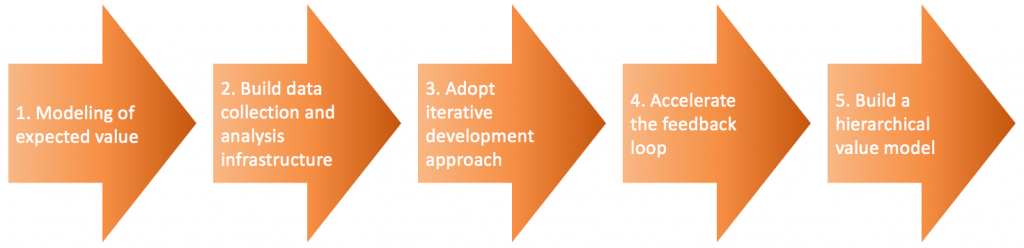
Over the last weeks, I have been writing about the five steps that companies go through when adopting data-driven development (see figure below). This article describes the final step when companies build a hierarchical value model where the relationship between slow moving, lagging business KPIs and faster moving, leading lower level factors is established quantitatively.
Concluding, research by us and others show that many features that are built by companies today are never used or used so seldomly that the R&D effort is not justified. Therefore, we need to become much selective in how we build functionality. Data-driven development allows us to build features in slices, deploy these slices and measure whether the expected value is actually realized in practice. Rapid feedback allows teams to adjust their development trajectory to maximize the amount of business value delivered, even if it means abandoning a feature that turns out not to deliver any value. In that case, you at least didn’t clutter the user experience and the system software.
Adopting data-driven development allows for significant improvements in the effectiveness of your R&D in terms of the amount of business value created for every unit of R&D resource invested. This is a key competitive differentiator for organizations and consequently critical to adopt. In an age of connectivity, continuous deployment, big data and AI, you simply cannot afford to not adopt these practices. Let’s focus on progress!
To get more insights earlier, sign up for my newsletter at jan@janbosch.com or follow me on janbosch.com/blog, LinkedIn (linkedin.com/in/janbosch) or Twitter (@JanBosch).
